Unity Profiler可以查看每一帧游戏的渲染、加载和内存,并且它可以精确到耗时资源本身。
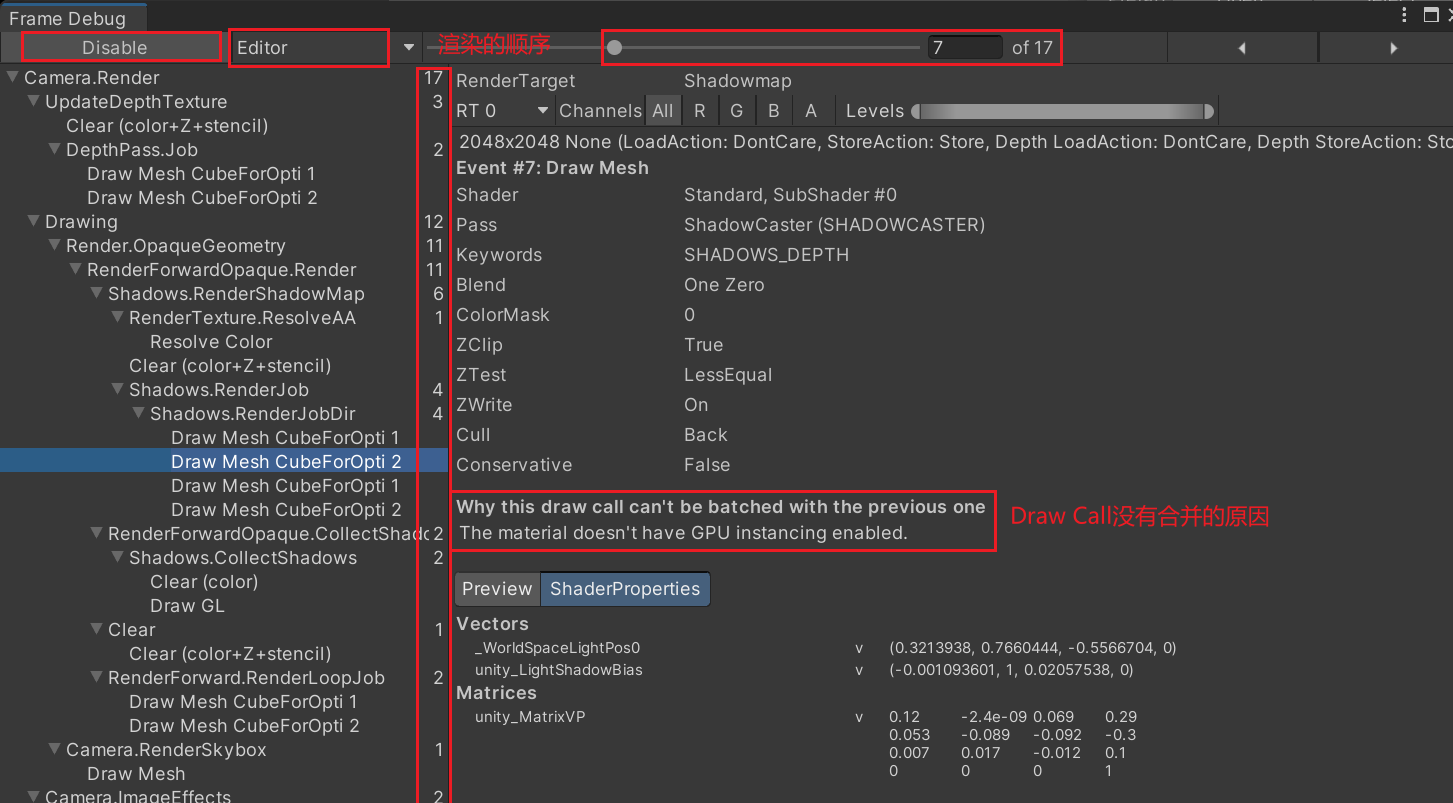
Frame Debugger工具用来查看渲染DrawCall顺序,进一步查出为什么DrawCall没有合并。
重复无用资源 在游戏开发过程中,经常会换UI、模型和资源等,时间长了就会积累出很多无用的资源,其中有些资源已经废弃了但还被用着,或者资源发生了重复,重复的资源还分别被有些对象所依赖。所以需要做一个工具来自动找出这些不合理的资源,统一处理掉。
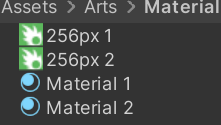
我们新建两个材质,这些材质都引用相同的贴图,但是我们把贴图复制成了两份,两个材质分别引用其中一份。
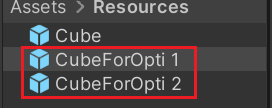
我们新建两个Cube的Prefab,这两个Cube分别引用了其中一份材质,将这两个Prefab都放在Resources文件夹下
新建CheckRepetitive脚本
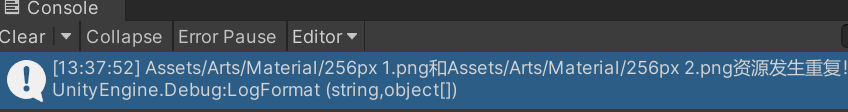
1
2
3
4
5
6
7
8
9
10
11
12
13
14
15
16
17
18
19
20
21
22
23
24
25
26
27
28
29
30
31
32
33
34
35
36
37
38
39
40
41
42
43
44
45
46
47
using System.Collections;using System.Collections.Generic;using UnityEngine;using UnityEditor;using System;using System.IO;using System.Security.Cryptography;public class CheckRepetitive { [MenuItem("Tools/Report/查找重复贴图" ) ] static void ReportTexture () Dictionary<string ,string > md5dic = new Dictionary<string , string >(); string [] paths = AssetDatabase.FindAssets("t:prefab" ,new string []{"Assets/Resources" }); foreach (var prefabGuid in paths){ string prefabAssetPath = AssetDatabase.GUIDToAssetPath(prefabGuid); string [] depend = AssetDatabase.GetDependencies(prefabAssetPath,true ); for (int i = 0 ; i < depend.Length; i++) { string assetPath = depend[i]; AssetImporter importer = AssetImporter.GetAtPath(assetPath); if (importer is TextureImporter || importer is ModelImporter){ string md5 = GetMD5Hash(Path.Combine(Directory.GetCurrentDirectory(),assetPath)); string path; if (!md5dic.TryGetValue(md5,out path)) md5dic[md5] = assetPath; else if (path != assetPath) Debug.LogFormat("{0}和{1}资源发生重复!" ,path,assetPath); } } } } static string GetMD5Hash (string filePath MD5 md5 = MD5.Create(); return BitConverter.ToString(md5.ComputeHash(File.ReadAllBytes(filePath))).Replace("-" ,"" ).ToLower(); } }
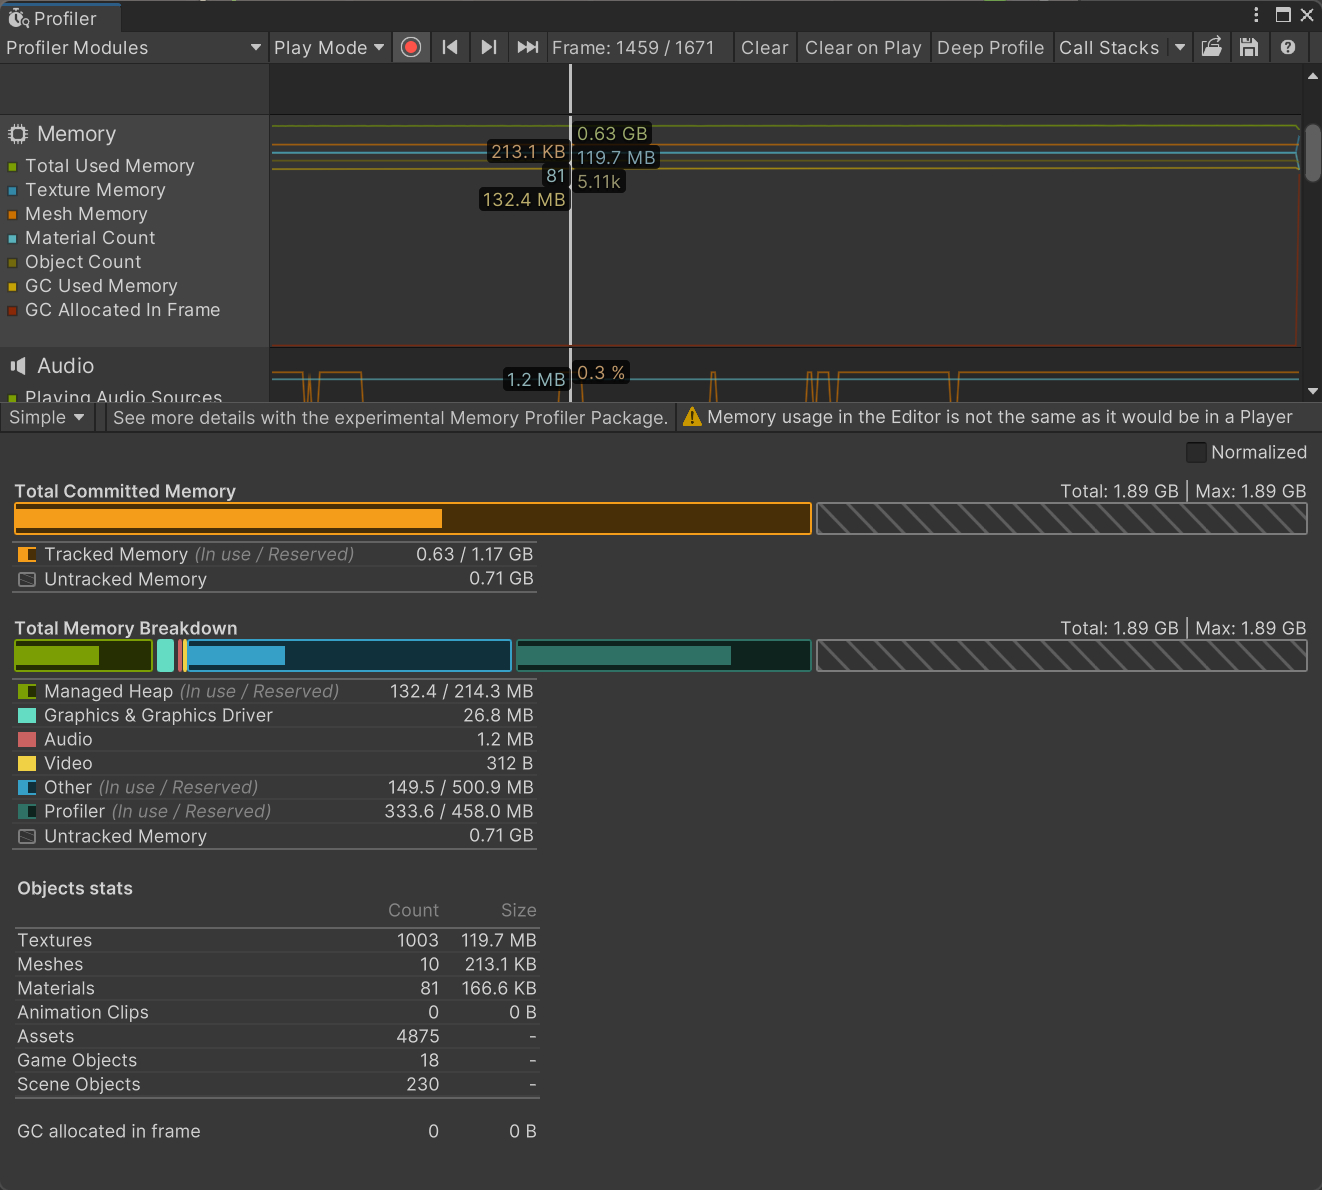
查看内存 要优化内存,可以使用Unity自带的Profiler工具,它可以查看每一帧内存的各项占用,并且可以精确到每一个资源(新版Unity编辑器中,精确查看内存资源需要额外安装MemoryProfiler包:Memory Profiler | Memory Profiler | 0.7.0-preview.2 (unity3d.com) )。新版Unity Profiler对编辑模式和运行模式内存资源占用区分的比较明显。
我们在Build Settings里面打包的时候,勾选Development Build,这样打出来的包就可以接入Profiler查看内存占用情况了。在以前使用先打包再测试的方式是因为早期Profiler对编辑器内存和运行时内存区分不好,打手机包测试比较麻烦,可以先打一个PC包,占用内存最多的一般都是贴图文件。展开Texture2D,使用MemoryProfiler查看每一张图具体占用。如果图片压缩格式不合理,就及时修改。
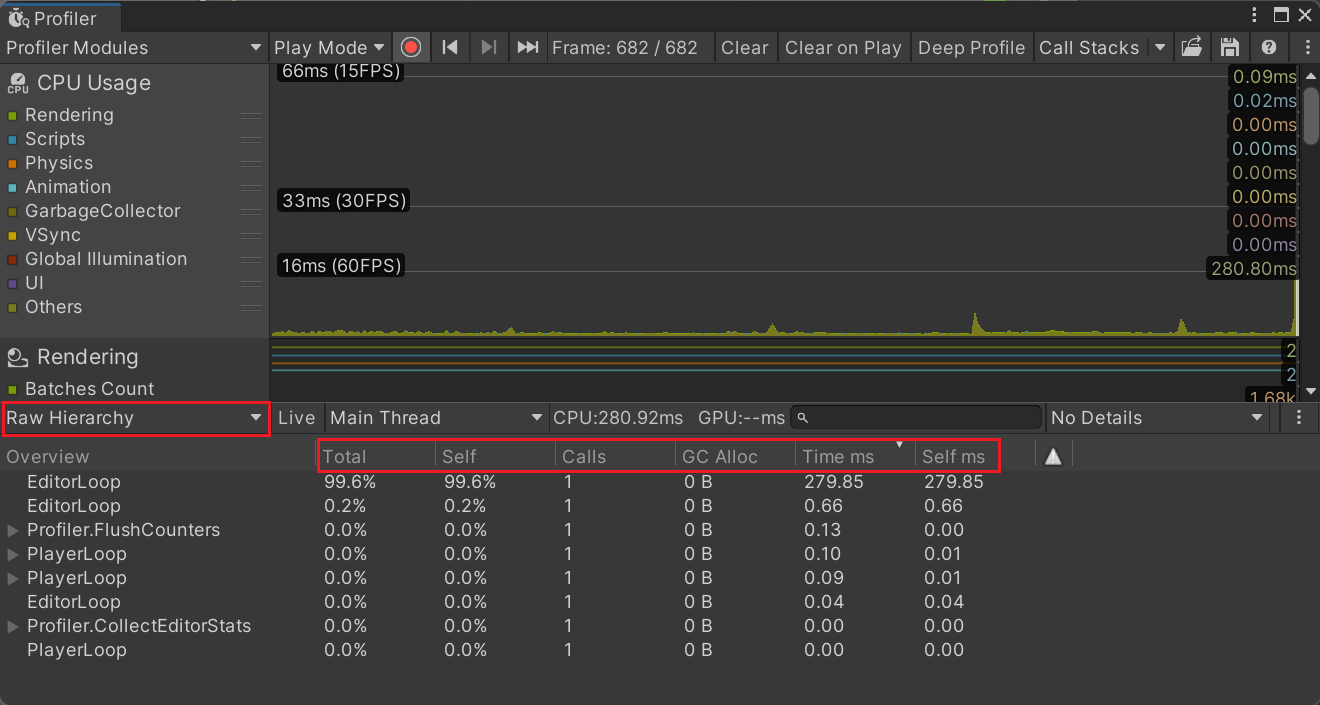
查看CPU效率 使用Profiler工具,还可以查看CPU。一般情况下,游戏中都是CPU比较耗时,尤其是同步读取大量资源的时候,此时Profiler中就能看到明显的波峰。Total表示占总效率的百分比,self表示它自身占效率的百分比(不包括子元素的耗时),Calls表示调用次数,GC Alloc表示申请的堆内存大小,Time表示总共耗费的秒数,Self表示自身耗时的秒数(不包括子元素的耗时)。通过面板中的信息决定耗时的位置。
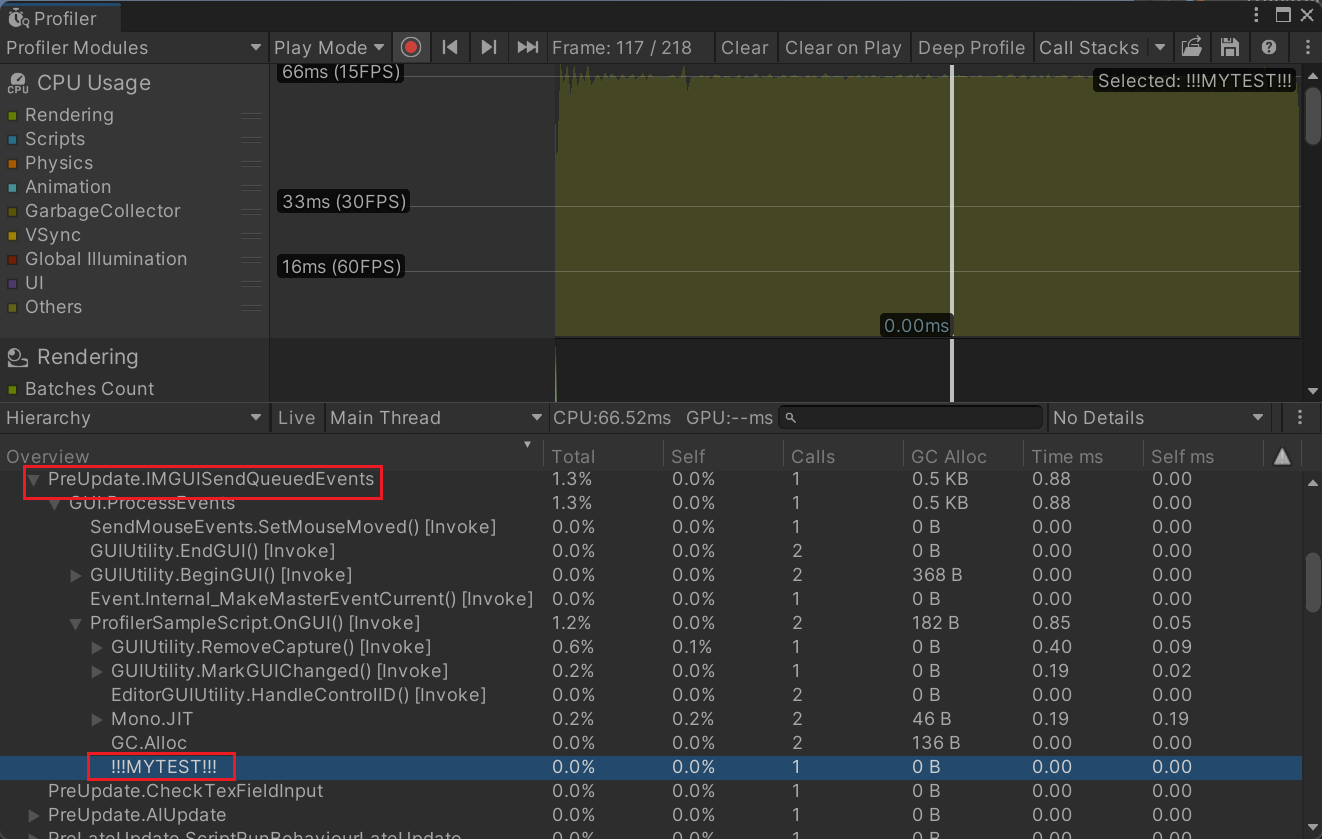
自定义观察区间 将Profiler.BeginSample()和Profiler.EndSample()添加在需要查看效率的代码中,即可在Profiler中查看它整体的消耗情况。
1
2
3
4
5
6
7
8
9
10
11
12
13
14
15
16
17
18
using UnityEngine;using UnityEngine.Profiling;public class ProfilerSampleScript : MonoBehaviour { private void Awake () Application.targetFrameRate = 15 ; } void Test () Profiler.BeginSample("!!!MYTEST!!!" ); for (int i = 0 ; i < 10000 ; i++){} Profiler.EndSample(); } void OnGUI () if (GUILayout.Button("test" )) Test(); } }
游戏中有一些代码如果不是通过Monobehaviour管理,是不会在Profiler中显示的,所以需要在不依赖monobehaviour的代码中使用Profiler.BeginSample()和Profiler.EndSample()来依赖Unity Profiler查看性能。
Profiler信息导出与导入 Profiler的信息可以在真实设备上导出,比如,从手机上调试不太方便时,可以通过代码把信息导出来在计算机上查看
新建UploadProfilerInfo脚本
1
2
3
4
5
6
7
8
9
10
11
12
13
14
15
16
17
18
19
20
21
22
23
24
25
26
27
28
29
30
31
32
using UnityEngine;using UnityEngine.Profiling;using System.IO;using System;public class UploadProfilerInfo : MonoBehaviour { private void OnGUI () if (GUILayout.Button("开始记录Profiler" )) StartRecord(); if (GUILayout.Button("结束记录Profiler" )) StopRecord(); } public static void StartRecord () { string fileName = string .Format("ProfilerData_{0}.data" ,DateTime.Now.ToString("hhmmss" )); if (Application.isEditor) Profiler.logFile = Path.Combine(Application.dataPath+"/.." ,fileName); else Profiler.logFile = Path.Combine(Application.persistentDataPath,fileName); Profiler.enabled = true ; Profiler.enableBinaryLog = true ; } public static void StopRecord () { UnityEngine.Profiling.Profiler.enabled = false ; UnityEngine.Profiling.Profiler.enableBinaryLog = false ; UnityEngine.Profiling.Profiler.logFile = "" ; } }
在Profiler窗口中点击导入即可查看
Frame Debugger 在Frame Debugger窗口中,可以查看渲染的顺序,了解DrawCall的数量是如何产生的。还会对DrawCall没有合并的原因进行解释。